Fichier:Solar-cycle-data-German.png
Solar-cycle-data-German.png (700 × 466 Pixel, Fichiersgréisst: 40 KB, MIME-Typ: image/png)
Translation
This is the German translation of the original English image, created by Xavax.
Resumé


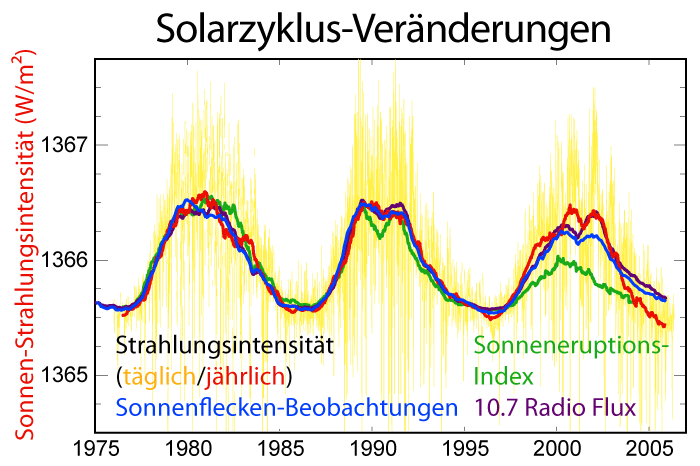
This picture depicts the last three solar cycles as measured in solar irradiance, sunspot numbers, solar flare activity, and 10.7 cm radio flux. Solar irradiance, i.e the direct solar power at the top of the Earth's atmosphere, is depicted as both a daily measurement and a moving annual average. All other data are depicted as the annual average value.
The ~11 year solar magnetic cycle is a fundemental aspect of the sun's behavior and is associated with variations in total output and activity. Irradiance measurements have only been available during the last three cycles and are based on a composite of many different observing satellites. [1] However, the high correlation between irradiance measurements and other proxies of solar activity make it reasonable to estimate past solar activity. Most important among these proxies is the record of sunspot observations that has been recorded since ~1610. Since sunspots and associated faculae are directly responsible for small changes in the brightness of the sun, they are closely correlated to changes in solar output. Direct measurements of radio emissions from the sun also provide a proxy of solar activity that can be measured from the ground since such solar radiation is not substantially affected by the atmosphere. Lastly, solar flares are a type of solar activity that can impact life on Earth by affecting electrical systems, especially satellites. Flares only occur in the presence of sunspots, and hence the two are correlated, but flares are not directly tied to total solar luminosity.
Recently, it appears that solar irradiance is varying in ways that aren't duplicated by changes in sunspot observations or radio emissions. However, this conclusion is disputed. Some believe that shifts in irradiance may be the result of calibration problems in the measuring satellites.[1][2] These speculations also admit the possibility that a small long term trend might exist in solar irradiance, though the data chosen for this plot do not have a significant trend.[3] Also, the differences in flare activity over the three cycles would not be related to possible measurement artifacts in irradiance.
With respect to global warming, though solar activity has been at relatively high levels during the recent period, the fact that solar activity has been near constant during the last 30 years precludes solar variability from playing a large role in recent warming. It is estimated that the resdiual effects of the prolonged high solar activity account for between 18 and 36% of warming from 1950 to 1999.[4]
Copyright
This image was created by Robert A. Rohde from the published data listed below and replaces an image created by William M. Connolley. It is part of the Global Warming Art project.

|
Et ass erlaabt, dëse Fichier ënner de Bedingunge vun der GNU-Lizenz fir fräi Dokumentatioun, an der Versioun 1.2 oder enger spéiderer Versioun, verëffentlecht vun der Free Software Foundation, ze kopéieren, ze verbreeden an/oder zu modifizéieren, ouni onverännerlech Abschnitter, Ëmschlagtext virdrun, Ëmschlagtext hannendrun. De kompletten Text vun der Lizenz ass am Kapitel GNU-Lizenz fir fräi Dokumentatioun ze gesinn. |
| Dëse Fichier ass ënner der Creative Commons Attribution-Share Alike 3.0 Unported Lizenz disponibel. | ||
| ||
| Dës Lizenz-Markéierung gouf bei dëse Fichier dobäigesat als Deel vun der GFDL Lizenz-Aktualisatioun. |
Data sources
- Irradiance: http://www.pmodwrc.ch/pmod.php?topic=tsi/composite/SolarConstant
- International sunspot number: http://www.ngdc.noaa.gov/stp/SOLAR/ftpsunspotnumber.html
- Flare index: http://www.koeri.boun.edu.tr/astronomy/readme.html
- 10.7cm radio flux: http://www.drao-ofr.hia-iha.nrc-cnrc.gc.ca/icarus/www/sol_home.shtml
References
- ↑ Richard C. Willson, Alexander V. Mordvinov (2003). "Secular total solar irradiance trend during solar cycles 21–23". Geophysical Research Letters 30 (5): 1199.
- ↑ Steven DeWitte, Dominiqu Crommelynck, Sabri Mekaoui, and Alexandre Joukoff (2004). "MEASUREMENT AND UNCERTAINTY OF THE LONG-TERM TOTAL SOLAR IRRADIANCE TREND". Solar Physics 224: 209–216.
- ↑ Fröhlich, C. and J. Lean (2004). "Solar Radiative Output and its Variability: Evidence and Mechanisms". Astronomy and Astrophysical Reviews 12: 273-320.
- ↑ Stott, Peter A.; Gareth S. Jones and John F. B. Mitchell (15 December 2003). "Do Models Underestimate the Solar Contribution to Recent Climate Change". Journal of Climate 16: 4079-4093. Retrieved on October 5.
Versiounen
Klickt op e bestëmmten Zäitpunkt fir déi respektiv Versioun vum Fichier ze kucken.
| Versioun vum | Miniaturbild | Dimensiounen | Benotzer | Bemierkung | |
|---|---|---|---|---|---|
| aktuell | 22:56, 8. Okt. 2006 | | 700 × 466 (40 KB) | Xavax | == Description == thumb|right|350px|Variations in sunspot number since 1610. thumb|right|250px|Changes in solar activity since 1400. This picture depicts the last three solar cycles |
Benotze vu Fichieren
Dës Säit benotzt dëse Fichier:
Globaalt Benotze vum Fichier
Dës aner Wikie benotzen dëse Fichier:
- Benotzt op ar.wikipedia.org
- Benotzt op de.wikipedia.org
- Benotzt op de.wikiversity.org
- Benotzt op es.wikipedia.org
- Benotzt op rm.wikipedia.org